
🚀 Update: This tutorial has evolved into MaverickMCP, a production-ready trading platform with 29 professional tools, 4x faster performance, and one-command setup. Read about the complete transformation here.
Hey folks! If you’ve been following my series on AI-powered trading, you’ve seen how we built up to a full agent using LangChain and LangGraph in previous articles. Today, I’m taking a fresh angle—creating a dedicated MCP server for stock analysis that any AI assistant can access. Think of it as giving Claude its own Bloomberg Terminal (okay, maybe not quite that fancy, but you get the idea).
What is MCP?
The Model Context Protocol (MCP) is an open protocol that standardizes how AI models interact with external tools, data sources, and systems. For traders and financial developers, MCP provides a structured way to expose market data, analysis tools, and trading capabilities to Large Language Models (LLMs) like Claude.
The protocol’s architecture centers around three key primitives: resources for exposing data, tools for executing actions, and prompts for templating interactions. This design allows secure, controlled access to financial data and trading functionality while maintaining a clear separation between AI capabilities and execution authority. While LLMs can analyze data and suggest trades through MCP, all actions require explicit human approval—a critical feature for maintaining oversight in financial operations on your local machine.
MCP’s significance in trading applications stems from its ability to standardize how AI assistants interact with financial data and trading infrastructure. Rather than building custom integrations for each AI model, developers can create a single MCP server that works with any compatible client. This approach reduces development overhead and ensures consistent behavior and security across AI implementations.
Getting Started with MCP
Let’s begin by initializing our project using the official MCP Python template, which provides a standardized foundation for building MCP servers. The template abstracts some underlying protocol complexity, allowing us to focus on implementing our trading-specific functionality.
We’ll also install the ta-lib library for much faster calculations of common technical indicators because it uses optimized, compiled C code instead of pure Python. The C library under the hood significantly reduces overhead in arithmetic loops and array operations, improving speed—especially for large datasets. I’m using Homebrew to install native binaries in macOS, but the ta-lib docs have instructions for other operating systems.
# Install ta-lib
brew install ta-lib

# Create our project using uvx
uvx create-mcp-server # name the project mcp-trader

# Activate the environment and install dependencies
cd mcp-trader
source .venv/bin/activate  # or '.venv\Scripts\activate' on Windows

# Install dependencies
uv sync --dev --all-extras
uv add pandas pandas-ta ta-lib aiohttp python-dotenv numpy==1.26.4The MCP template streamlines the development process by providing essential server components like initialization, transport handling, and protocol conformance. I’ll extend this foundation with our stock analysis capabilities while maintaining clean architectural patterns.
Configuring Our Environment
While several market data providers are available (IEX Cloud, Alpha Vantage, etc.), I chose Tiingo for this project because it offers excellent historical stock data, a developer-friendly API, Websocket data, and generous rate limits, all for a fair price. Plus, their free tier is more than sufficient for our development needs.
touch .env
echo "TIINGO_API_KEY=your_api_key_here" >> .envProject Structure
The template creates a nice structure for us, but we’ll need to modify it for our stock analysis needs. Here’s what I’m aiming for:
mcp-trader/
├── pyproject.toml
├── README.md
├── .env
└── src/
    └── mcp-trader/
        ├── __init__.py
        ├── server.py          # Our core MCP server
        ├── indicators.py      # Technical analysis functions
└── data.py # Data fetching layerBuilding Our Data Layer
Let’s start with data.py – our gateway to market data:
import os
import aiohttp
import pandas as pd

from datetime import datetime, timedelta
from dotenv import load_dotenv

load_dotenv()


class MarketData:
    """Handles all market data fetching operations."""

    def __init__(self):
        self.api_key = os.getenv("TIINGO_API_KEY")
        if not self.api_key:
            raise ValueError("TIINGO_API_KEY not found in environment")

        self.headers = {"Content-Type": "application/json", "Authorization": f"Token {self.api_key}"}

    async def get_historical_data(self, symbol: str, lookback_days: int = 365) -> pd.DataFrame:
        """
        Fetch historical daily data for a given symbol.

        Args:
            symbol (str): The stock symbol to fetch data for.
            lookback_days (int): Number of days to look back from today.

        Returns:
            pd.DataFrame: DataFrame containing historical market data.

        Raises:
            ValueError: If the symbol is invalid or no data is returned.
            Exception: For other unexpected issues during the fetch operation.
        """
        end_date = datetime.now()
        start_date = end_date - timedelta(days=lookback_days)

        url = (
            f"https://api.tiingo.com/tiingo/daily/{symbol}/prices?"
            f'startDate={start_date.strftime("%Y-%m-%d")}&'
            f'endDate={end_date.strftime("%Y-%m-%d")}'
        )

        try:
            async with aiohttp.ClientSession(timeout=aiohttp.ClientTimeout(total=10)) as session:
                async with session.get(url, headers=self.headers) as response:
                    if response.status == 404:
                        raise ValueError(f"Symbol not found: {symbol}")
                    response.raise_for_status()
                    data = await response.json()

            if not data:
                raise ValueError(f"No data returned for {symbol}")

            df = pd.DataFrame(data)
            df["date"] = pd.to_datetime(df["date"])
            df.set_index("date", inplace=True)

            df[["open", "high", "low", "close"]] = df[["adjOpen", "adjHigh", "adjLow", "adjClose"]].round(2)
            df["volume"] = df["adjVolume"].astype(int)
            df["symbol"] = symbol.upper()

            return df

        except aiohttp.ClientError as e:
            raise ConnectionError(f"Network error while fetching data for {symbol}: {e}")
        except ValueError as ve:
            raise ve  # Propagate value errors (symbol issues, no data, etc.)
        except Exception as e:
            raise Exception(f"Unexpected error fetching data for {symbol}: {e}")
Technical Analysis Layer
Next up is indicators.py, where we’ll create our technical analysis toolkit. Based on your strategy and preferences, you can add indicators from pandas-ta that you like. The library is comprehensive and performant, leveraging ta-lib we installed earlier, and it integrates well with the Pandas ecosystem.
import pandas as pd
import pandas_ta as ta

from typing import Dict, Any


class TechnicalAnalysis:
    """Technical analysis toolkit with improved performance and readability."""

    @staticmethod
    def add_core_indicators(df: pd.DataFrame) -> pd.DataFrame:
        """Add a core set of technical indicators."""
        try:
            # Adding trend indicators
            df["sma_20"] = ta.sma(df["close"], length=20)
            df["sma_50"] = ta.sma(df["close"], length=50)
            df["sma_200"] = ta.sma(df["close"], length=200)

            # Adding volatility indicators and volume
            daily_range = df["high"].sub(df["low"])
            adr = daily_range.rolling(window=20).mean()
            df["adrp"] = adr.div(df["close"]).mul(100)
            df["avg_20d_vol"] = df["volume"].rolling(window=20).mean()

            # Adding momentum indicators
            df["atr"] = ta.atr(df["high"], df["low"], df["close"], length=14)
            df["rsi"] = ta.rsi(df["close"], length=14)
            macd = ta.macd(df["close"], fast=12, slow=26, signal=9)
            if macd is not None:
                df = pd.concat([df, macd], axis=1)

            return df

        except KeyError as e:
            raise KeyError(f"Missing column in input DataFrame: {str(e)}")
        except Exception as e:
            raise Exception(f"Error calculating indicators: {str(e)}")

    @staticmethod
    def check_trend_status(df: pd.DataFrame) -> Dict[str, Any]:
        """Analyze the current trend status."""
        if df.empty:
            raise ValueError("DataFrame is empty. Ensure it contains valid data.")

        latest = df.iloc[-1]
        return {
            "above_20sma": latest["close"] > latest["sma_20"],
            "above_50sma": latest["close"] > latest["sma_50"],
            "above_200sma": latest["close"] > latest["sma_200"],
            "20_50_bullish": latest["sma_20"] > latest["sma_50"],
            "50_200_bullish": latest["sma_50"] > latest["sma_200"],
            "rsi": latest["rsi"],
            "macd_bullish": latest.get("MACD_12_26_9", 0) > latest.get("MACDs_12_26_9", 0),
        }
Customizing Our MCP Server
The template gives us a great starting point in server.py, but we need to transform it from a note-taking app into our stock analysis powerhouse. Let’s break down what we need to modify:
# Original imports - keep these
import mcp.types as types
import mcp.server.stdio

from mcp.server.models import InitializationOptions
from mcp.server import NotificationOptions, Server

# Add our new imports
from .data import MarketData
from .indicators import TechnicalAnalysis

# Replace the notes dictionary with our service instances
market_data = MarketData()
tech_analysis = TechnicalAnalysis()

# Keep the server initialization
server = Server("mcp-trader")

# We can remove the list_resources and read_resource handlers
# since we're not using them yet

# Remove the list_prompts and get_prompt handlers
# We'll focus on tools for now

@server.list_tools()
async def handle_list_tools() -> list[types.Tool]:
    """List our stock analysis tools."""
    return [
        types.Tool(
            name="analyze-stock",
            description="Analyze a stock's technical setup",
            inputSchema={
                "type": "object",
                "properties": {
                    "symbol": {
                        "type": "string",
                        "description": "Stock symbol (e.g., NVDA)"
                    }
                },
                "required": ["symbol"],
            },
        )
    ]

@server.call_tool()
async def handle_call_tool(
    name: str,
    arguments: dict | None
) -> list[types.TextContent | types.ImageContent | types.EmbeddedResource]:
    """Handle tool execution requests."""
    if name != "analyze-stock":
        raise ValueError(f"Unknown tool: {name}")

    if not arguments:
        raise ValueError("Missing arguments")

    symbol = arguments.get("symbol")
    if not symbol:
        raise ValueError("Missing symbol")

    try:
        # Fetch data
        df = await market_data.get_historical_data(symbol)

        # Add indicators
        df = tech_analysis.add_core_indicators(df)

        # Get trend status
        trend = tech_analysis.check_trend_status(df)

        analysis = f"""
Technical Analysis for {symbol}:

Trend Analysis:
- Above 20 SMA: {'✅' if trend['above_20sma'] else '❌'}
- Above 50 SMA: {'✅' if trend['above_50sma'] else '❌'}
- Above 200 SMA: {'✅' if trend['above_200sma'] else '❌'}
- 20/50 SMA Bullish Cross: {'✅' if trend['20_50_bullish'] else '❌'}
- 50/200 SMA Bullish Cross: {'✅' if trend['50_200_bullish'] else '❌'}

Momentum:
- RSI (14): {trend['rsi']:.2f}
- MACD Bullish: {'✅' if trend['macd_bullish'] else '❌'}

Latest Price: ${df['close'].iloc[-1]:.2f}
Average True Range (14): {df['atr'].iloc[-1]:.2f}
Average Daily Range Percentage: {df['adrp'].iloc[-1]:.2f}%
Average Volume (20D): {df['avg_20d_vol'].iloc[-1]}
"""

        return [types.TextContent(type="text", text=analysis)]

    except Exception as e:
        return [types.TextContent(
            type="text",
            text=f"\n<observation>\nError: {str(e)}\n</observation>\n"
        )]

# Keep the main function as is
async def main():
    async with mcp.server.stdio.stdio_server() as (read_stream, write_stream):
        await server.run(
            read_stream,
            write_stream,
            InitializationOptions(
                server_name="mcp-trader",
                server_version="0.1.0",
                capabilities=server.get_capabilities(
                    notification_options=NotificationOptions(),
                    experimental_capabilities={},
                ),
            ),
)The MCP template provides the underlying protocol implementation and transport layer management, allowing us to concentrate development efforts on stock analysis functionality. This architectural foundation ensures proper message handling, client communication, and protocol compliance. By extending the template’s separation between our domain logic and the MCP infrastructure, we maintain a clean separation between them. This approach enables rapid development of trading features while ensuring reliable integration with MCP-compatible clients.
Connecting to Claude Desktop
Let’s update our claude_desktop_config.json to use our new server in the Claude Desktop App:
{
  "mcpServers": {
    "stock-analyzer": {
      "command": "uv",
      "args": [
        "--directory",
        "/absolute/path/to/mcp-trader",
        "run",
        "mcp-trader"
      ],
      "env": {
        "TIINGO_API_KEY": "your API Key here"
      }
    }
  }
}Now we can build the project and fire up the server using uv:
uv build
uv run mcp-trader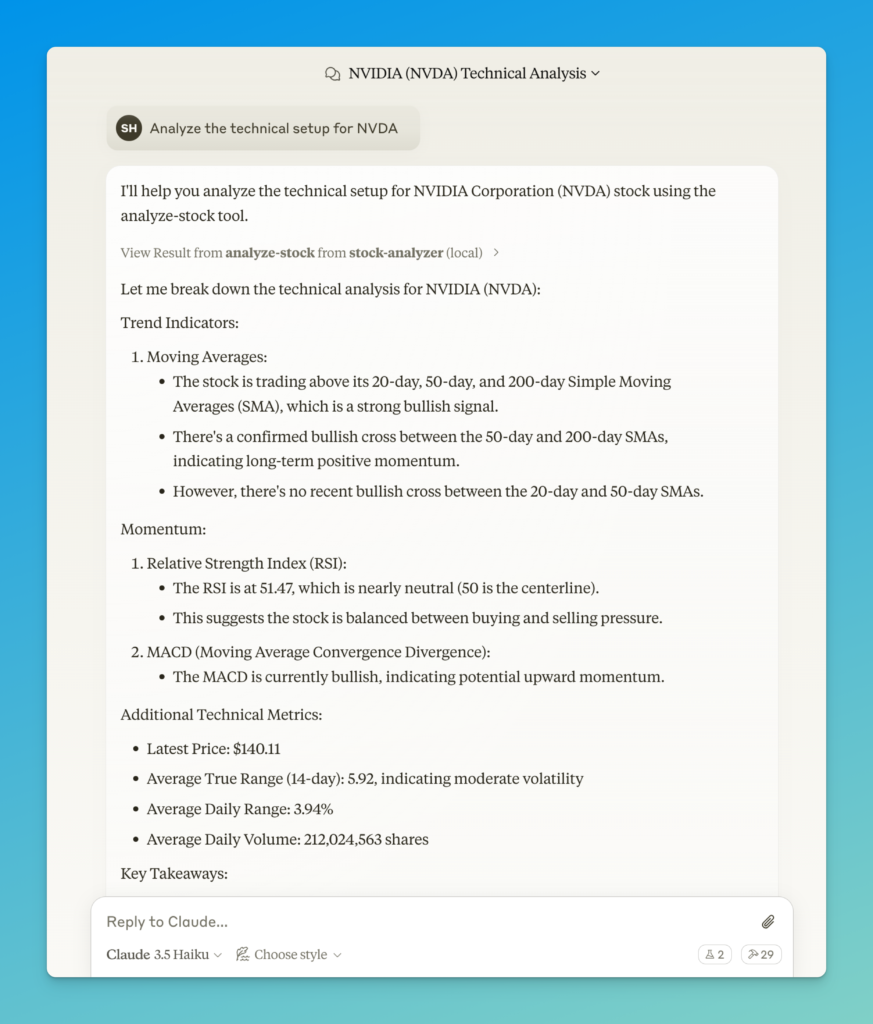
What’s Next?
In future articles, I’ll expand the server’s capabilities by adding:
- Relative Strength calculations
- Volume profile analysis
- Basic pattern recognition
- Risk analysis
I’ll also add some intelligence around entry points and risk levels – because no trader should rely solely on moving averages!
For readers interested in a complete AI trading solution, I’d like to ask you to please consider exploring Capital Companion, my AI-powered trading assistant with many technical analysis capabilities, intelligent risk management, and portfolio optimization features.
The complete code for this tutorial is available on my GitHub. Remember that technical analysis tools are just one component of a comprehensive trading strategy while we all continue swapping symbols.

We can use technical analysis like ema ,bollinger band ,rsi ,volatility index with fundamental analysis with like cash flow ,liquid money etc to enhance it capacity of correction and show case all these points in a graphic representation and using broker api to connect our mcp server to initiate trade using the information and make adjust in the trading of stock according to it .. there is a small point which is sentiment analysis which plays an important role if we are able to add that this service can change the way of trading completly…