Introduction
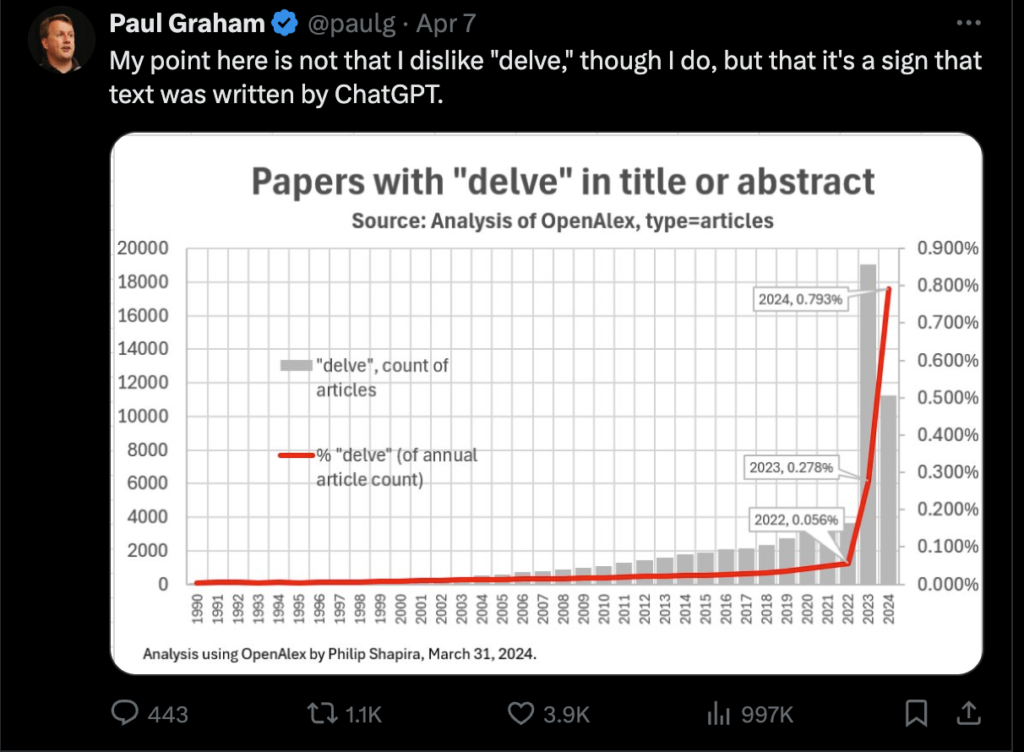
Hello, friends, and welcome back to this third installment in this blog series on building an AI-powered stock analysis tool. Here are links to the first and second posts. The social media reaction to this topic has been positive, and I look forward to taking you further on this journey. And, I promise, this stuff is delve-free even if understanding how LLMs learn lengthy context-free grammars is about as clear as a day trader’s crystal ball – but hey, at least we’re not relying on astrology to predict stock prices! Instead, let’s use a practical and statistically proven technique to identify strength: trendlines.

This blog post will focus on simple trendline detection, sector analysis, and sentiment analysis using popular libraries, algorithms, and OpenBB’s functions. It will further enhance the AI-powered stock analysis agent’s capabilities. The repo has been updated for your reference.
The Trend is Your Friend
- Simple Trendline Detection: Trendline detection is crucial in technical analysis. It helps identify the overall direction of a stock’s price movement. Traders can visually represent the trend by connecting highs or lows on a chart. This allows them to decide when to enter or exit a trade. Trendlines also identify potential support and resistance levels around supply and demand. Combined with other indicators and analysis, they contribute to more robust trading strategies. I can use the scikit-learn library to perform linear regression and detect trendlines in the stock data.
import pandas_ta as ta
import numpy as np
from sklearn.linear_model import LinearRegression


def detect_trendline(df):
    X = np.array(range(len(df))).reshape((-1, 1))
    y = df["close"].values.reshape((-1, 1))

    model = LinearRegression()
    model.fit(X, y)
    slope = model.coef_[0][0]

    return slope


def add_technicals(df):
    df["pct_change"] = df["close"].pct_change() * 100
    df["current_date"] = df.index.strftime("%Y-%m-%d")
    df["SMA_20"] = ta.sma(df["close"], length=20)
    df["SMA_50"] = ta.sma(df["close"], length=50)
    df["SMA_150"] = ta.sma(df["close"], length=150)
    df["SMA_200"] = ta.sma(df["close"], length=200)
    df["ATR"] = ta.atr(df["high"], df["low"], df["close"], length=14)
    df["RSI"] = ta.rsi(df["close"], length=14)
    df["52_WK_HIGH"] = df["close"].rolling(window=252).max()
    df["52_WK_LOW"] = df["close"].rolling(window=252).min()

    daily_range = df["high"] - df["low"]
    adr = daily_range.rolling(window=20).mean()

    df["ADR"] = (adr / df["close"]) * 100
    df["ADR_PCT"] = df["ADR"].fillna(0)

    df["TRENDLINE_SLOPE"] = detect_trendline(df)

    return df
Again, this is a simple algorithm for trendline detection for illustration purposes. There are far better libraries and techniques that consider more nuanced OHLC data. Here, a positive slope indicates an upward trend, while a negative slope suggests a downward trend, all based on the daily closing price. I can incorporate this function into the existing technical analysis tools to give the AI agent insights into the stock’s overall trend.
- Sector Analysis: Analyzing a stock’s performance within its sector can provide valuable context and help identify sector-wide trends. OpenBB offers sector analysis functions that retrieve sector-specific data.
from openbb import obb

@tool(args_schema=StockStatsInput)
def get_stock_general_info(symbol: str) -> str:
    """Fetch general information about a company by symbol. This includes company name, industry, and sector data."""

    try:
        profile = obb.equity.profile(symbol).to_df()
        if profile.empty:
            return f"\n<observation>\nNo data found for the given symbol {symbol}</observation>\n"

        return wrap_dataframe(profile)
    except Exception as e:
        return f"\n<observation>\nError: {e}</observation>\n"
By comparing a stock’s performance to its sector peers, the AI agent can identify whether it is outperforming or underperforming its sector and make more informed recommendations.
Markets Are Never Wrong – Opinions Often Are
- Sentiment Analysis: Sentiment analysis assesses the overall sentiment around a stock based on news, social media, and other textual data. As a trader, I recommend using sentiment analysis sparingly, as the heading suggests. A robust data analysis technique for marketing is only sometimes practical in the stock market. Decision-making lies in the experienced trader’s hands, not the will of the mob and their emotions. That being said, sentiment can be helpful. I will use the VADER library for this. While I could have used distributed Claude 3 Haiku for LLM-based sentiment analysis, VADER offers several advantages. These include efficiency, speed, a domain-specific lexicon, and deeper customization.

from langchain_core.pydantic_v1 import BaseModel, Field
from langchain.agents import tool
from vaderSentiment.vaderSentiment import SentimentIntensityAnalyzer
from openbb import obb

from app.tools.utils import wrap_dataframe


class StockStatsInput(BaseModel):
    symbol: str = Field(..., description="Stock symbol to fetch data for")


def analyze_sentiment(text):
    if text is None:
        return 0.0

    try:
        analyzer = SentimentIntensityAnalyzer()
        sentiment = analyzer.polarity_scores(text)
        if "compound" in sentiment:
            return sentiment["compound"]
        else:
            return 0.0
    except Exception:
        return 0.0


@tool
def get_news_sentiment(symbol: str) -> str:
    """Get News Sentiment for a Stock."""

    try:
        df = obb.news.company(symbol=symbol, provider="tiingo", limit=10).to_df()

        if df.empty:
            return "\n<observation>\nNo data found for the given symbol</observation>\n"

        if "text" in df.columns:
            df["sentiment_score"] = df["text"].apply(analyze_sentiment)
        else:
            df["sentiment_score"] = df["title"].apply(analyze_sentiment)

        return wrap_dataframe(df)
    except Exception as e:
        return f"\n<observation>\nError: {e}</observation>\n"
By incorporating sentiment analysis into the AI agent, one can gauge market sentiment and factor it into the decision-making process as another data point.
- Updating the Prompt Template: I need to update the prompt template with new instructions to leverage these new capabilities.
HUMAN_TEMPLATE = """
...
CRITERIA FOR BULLISH SETUPS:
----------------------------
...
11. Stock's trendline slope is positive and rising.
...
"""
It may come as a surprise that I’m only interested in adding a positive slope to my ruleset. Trends are obligatory for my trading style; however, sector relative strength and sentiment are data points in a much larger mental equation of building conviction in what to trade. Remember those “edges” I talked about?


And that phrase…relative strength. What does that mean? Can it be computed? Does it provide value to the agent? In short, absolutely! It’s one of the most significant critical factors in my trading. I will explore it in the next post.
Conclusion
This post explored how trendline detection, sector analysis, and sentiment analysis enhance the AI-powered stock analysis agent. By using libraries like scikit-learn, VADER, and OpenBB, one can create a more comprehensive tool for traders and investors. The agent can now detect trends, compare stocks to sector constituents, and gauge market sentiment.
As we refine the AI agent, we must explore new techniques and data sources. This will improve its performance and decision-making. The possibilities are endless, and I’m excited to see how it evolves and empowers traders. Stay tuned for the next post, where I’ll dive into analysis techniques and optimize the AI agent as I continue swapping symbols.
